by Rakesh Pal.
Finished file download in link below
https://drive.google.com/file/d/1lKct_ZHdpW7fyZZGKeBPHaawTs7a5Tg_/view?usp=sharing
Our Goals:
- Create a unique list of words that appear in a book.
- Create a count of how many times those words appear.
The steps involved
- Download a book
- Load & Clean up the book – Power BI
- Analyse the book – Power BI
- Present our data – Visualizations
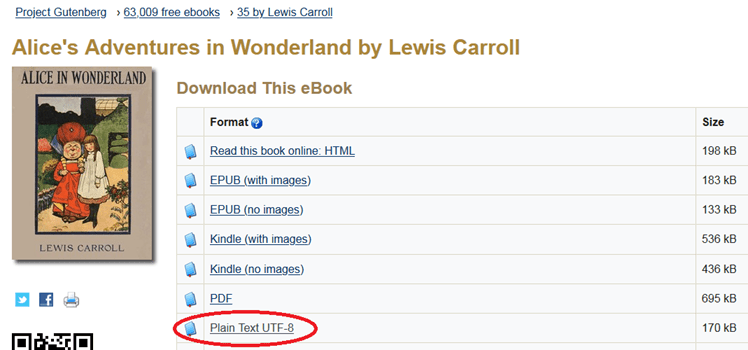
Download a book.
I’m using Alice in Wonderland, which I downloaded from http://www.gutenberg.org/ebooks/11 – the Plain Text version, .txt file format.
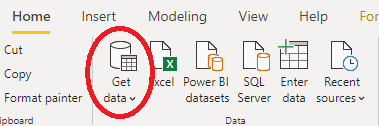
Load the book into Power BI
Start Power BI Desktop
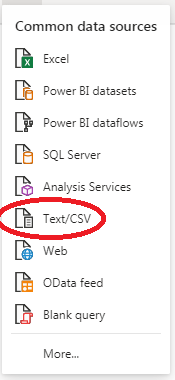
Home Ribbon > Get Data > Text/CSV
Find the location of your downloaded book. Press OK.
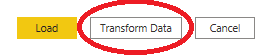
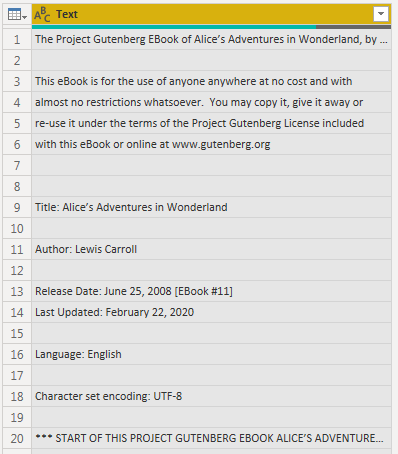
Preview window will appear
Click on Transform Data
Power Bi loads the Book correctly. In the Excel version of this tutorial, we had to edit the MCode to achieve the same result.
Rename the Column to “Text”
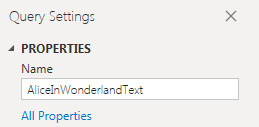
Rename your Query to something meaningful.
Cleaning up the data
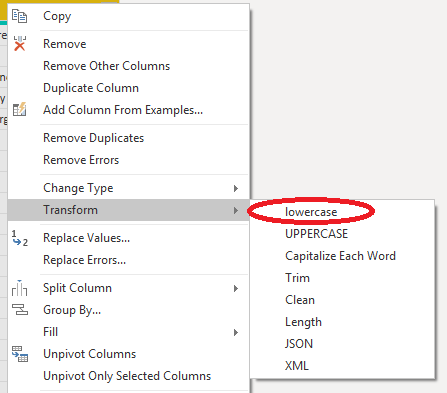
Lowercase all of the Text.
Right Click the Text Column > Transform > lowercase
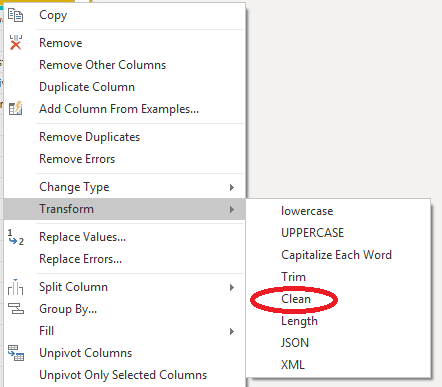
Remove all of the linefeeds and non-printable characters.
Right Click the Text Column > Transform > Clean
Remove unwanted characters
These include “.” “,” “#” and so on, including numerical values.
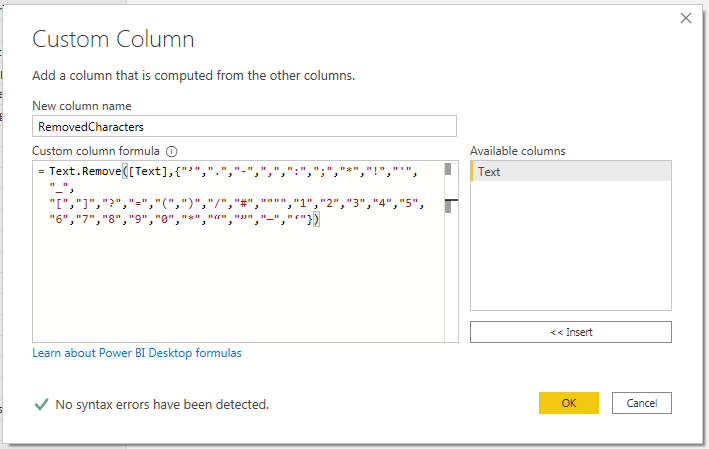
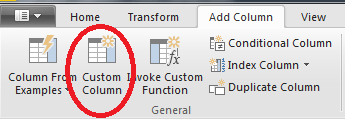
Add Column Ribbon > Custom Column

Custom Colum window appears
Copy and paste in the formula below into the Custom Column Formula box
Text.Remove([Text],{“’”,”.”,”-“,”,”,”:”,”;”,”*”,”!”,”‘”,”_”,”[“,”]”,”?”,”=”,”(“,”)”,”/”,”#”,””””,”1″,”2″,”3″,”4″,”5″,
“6”,”7″,”8″,”9″,”0″,”*”,”“”,”””,”—”,”‘”})
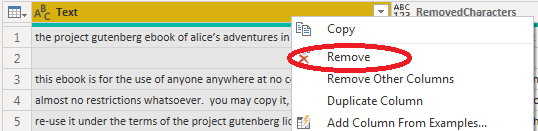
Remove the Text Column
Right Click the Text Column > Remove
Remove unwanted words – such as “http” “www” “Gutenberg” “ebook”.
Right Click RemoveCharacters Column > Replace Values
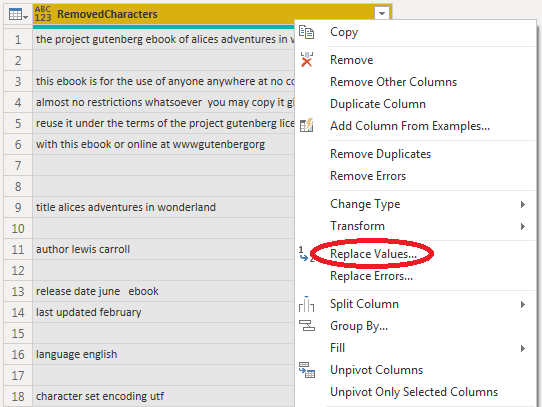
Replace Values window
Type in “http”, leave Replace With box blank, and Press OK
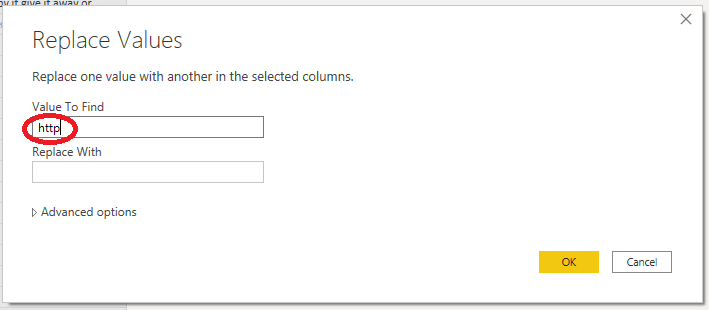
Repeat the above process for the other words, “www” “Gutenberg” “ebook” etc.
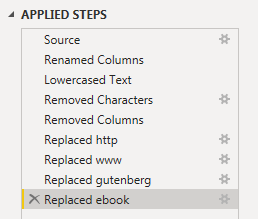
Rename the steps in the Appiled Steps window to something meaningful – easier to understand our code if we need to revisit it.
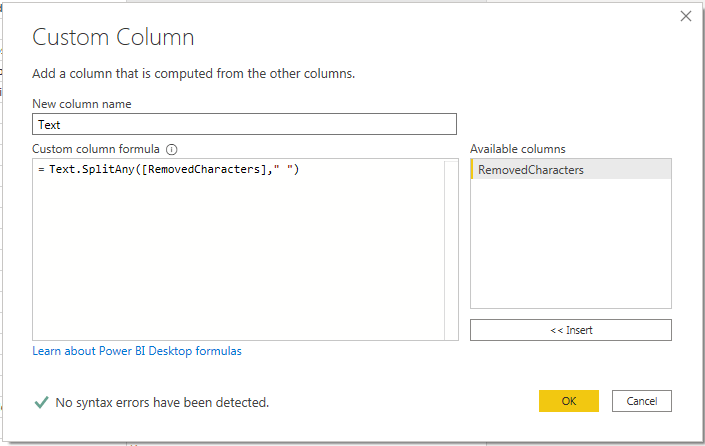
Split each Row into a List of Words, using the Text.SplitAny function.
Add Column Ribbon > Custom Column
Enter the following Formula to the Custom Column Formula box
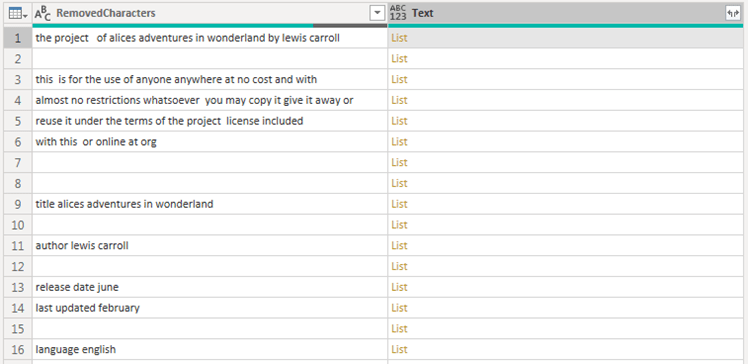
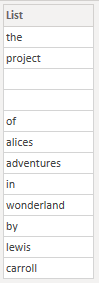
By highlight a List in the Text Column, we can observe a preview of its contents at the bottom of the screen.
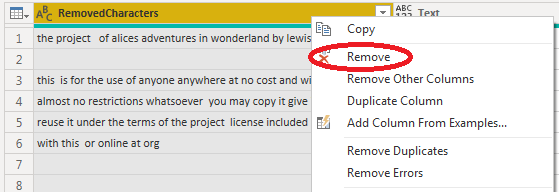
Remove RemovedCharacters Column
Right Click the Column > Remove
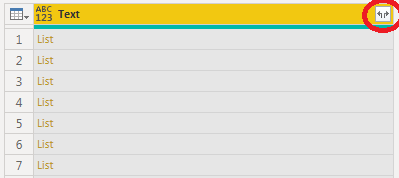
Expand the Lists.
Press the icon at the right corner of the Column.
The expanded List
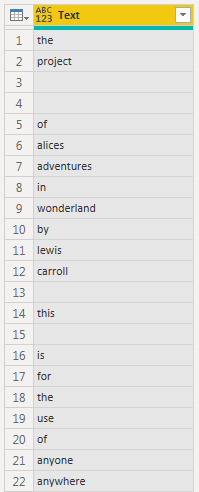
Remove the blank Rows
Press the FX button to add a new Step.
Type in the following Formula into the Formula Bar.

Create a Unique List of Words
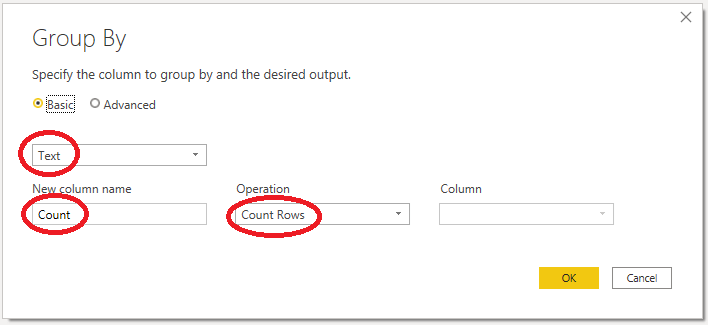
To create a Unique List of Words, we can use the Group By function to group each of the words in our Table. Additionally, we can create a count of how many times those words appear.
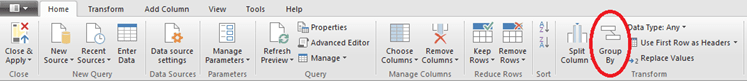
Home Ribbon > Group By
Group By window
Select the following options
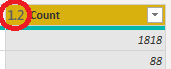
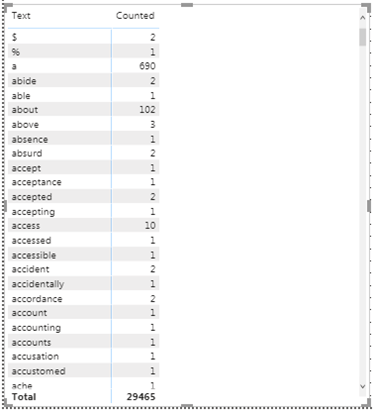
Result of the Group By function
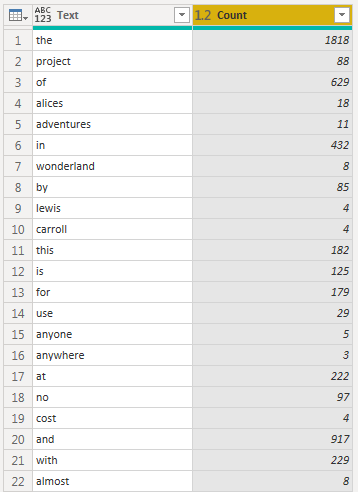
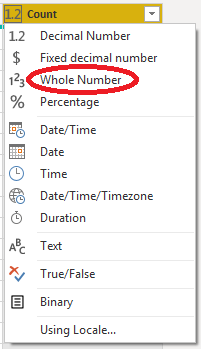
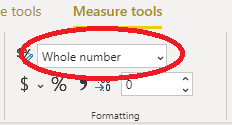
Change Count Columns number formatting to Whole Number.
Load the Table into the Data Model
Right Click the Query, and check the Enable Load box.
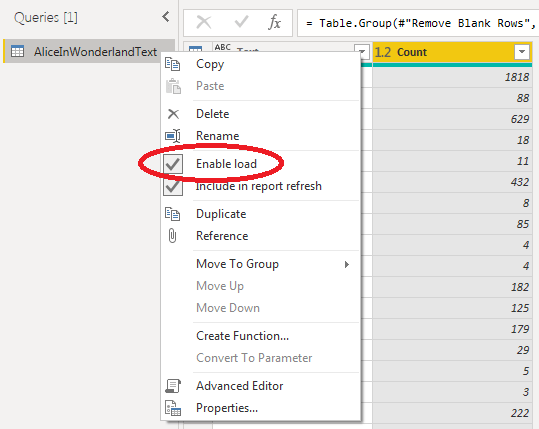
Press the Close & Apply button to load the Data and return to the Power BI Desktop main window.

Analyse the Data
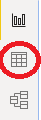
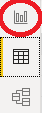
Select the Data View (i.e. Table View)
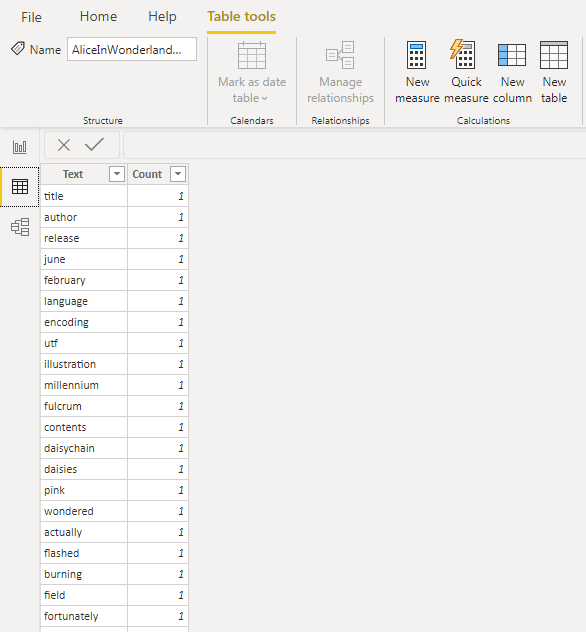
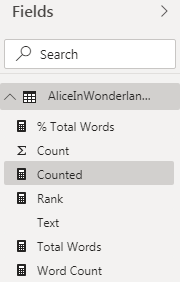
The AliceInWonderLand Table appears on the right hand side of the screen, along with any Columns and Measures it contains.
Create our Measures
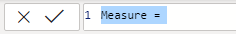
A Measure takes the following format:
Measure Name = Measure Code
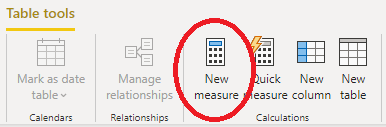
To create a Measure, Table Tools Ribbon > New Measure
Enter in the following Measures into the Formula Bar, and press Enter
Counted = SUM(AliceInWonderlandText[Count])
Total Words = CALCULATE([Counted],ALL(AliceInWonderlandText))
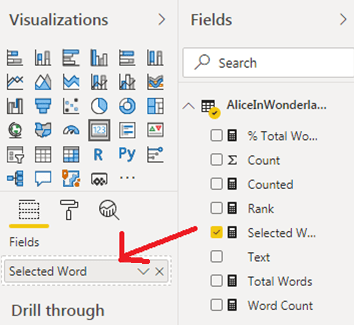
Selected Word = SELECTEDVALUE(AliceInWonderlandText[Word],” “)
Rank = IF(SELECTEDVALUE(AliceInWonderlandText[Word]) <> “”,RANKX(ALL(AliceInWonderlandText),[Counted],,DESC,Dense),”-“)
Word Count = IF(SELECTEDVALUE(AliceInWonderlandText[Word]) <> “”,[Counted],”-“)??
% Total Words = IF(SELECTEDVALUE(AliceInWonderlandText[Word]) <> “”,DIVIDE([Counted],[Total Words]),”-“)
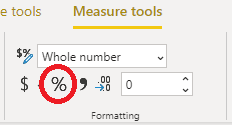
Apply Number Formatting to the Measures
To apply number Formatting, select a Measure from the Fields panel, and Select the required Formatting options in Measure Tools > Formatting group.
Apply Whole Number Formatting to Counted, Total Words, Rank & Word Count
Apply % Formatting to % Total Words
Return to the Report View.
Present our Data.
Enable Gridlines, to help organize our Visualizations.
View Ribbon > Enable Gridlines
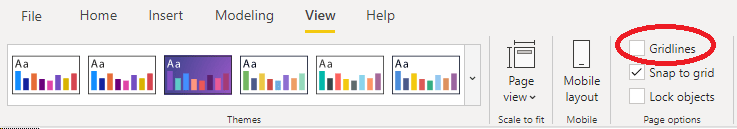
Objects will snap to the Gridlines
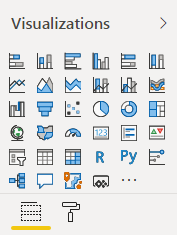
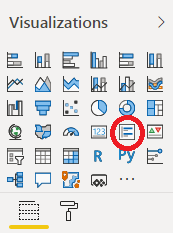
Visualizations panel
Select a Visualization to insert it into the Report View.
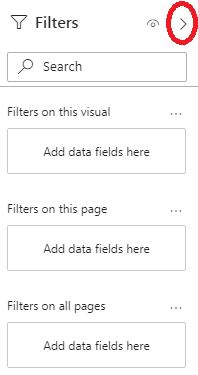
Minimize the Filters panel
Click the arrow.
Insert Matrix – similar to a PivotTable in Excel
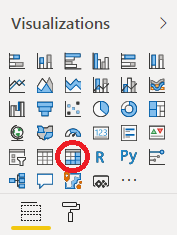
Matrix object appears on Report View Grid
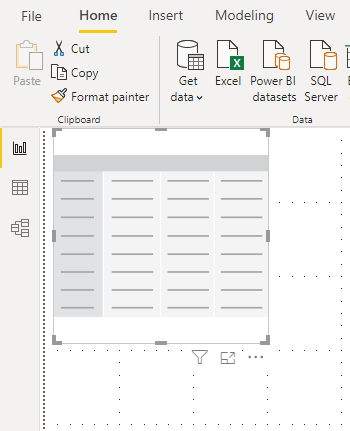
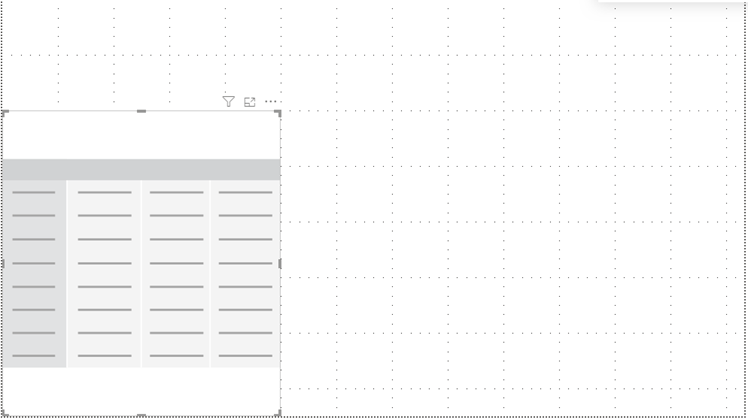
Move and resize the Matrix Object
A Matrix can be populated similarly to a PivotTable in Excel.
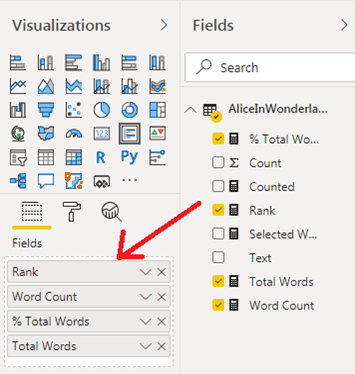
Items in the Fields Panel can be dragged onto the Rows, Columns, and Values boxes.
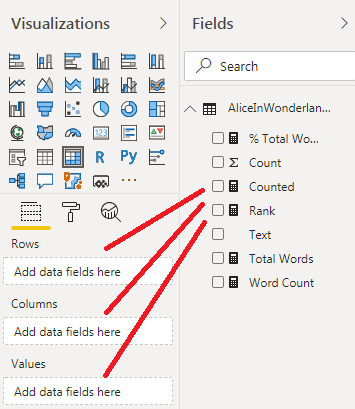
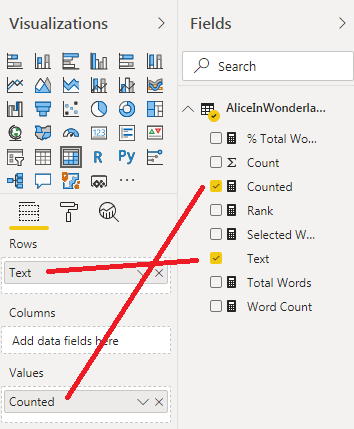
Drag the Fields as displayed below – to populate the Matrix
Note: Populating and Formatting an Object
Make sure you select the Object first, otherwise you won’t be able to make any changes.
Object – Not Selected
Object – Selected
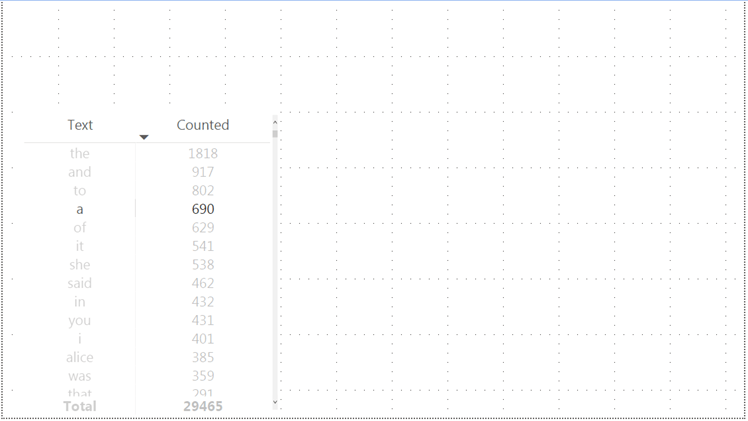
Continuing with the newly created Matrix Object
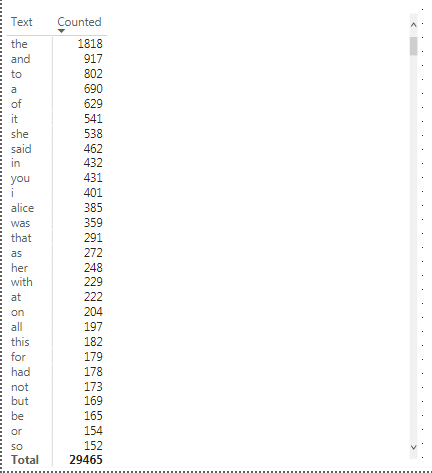
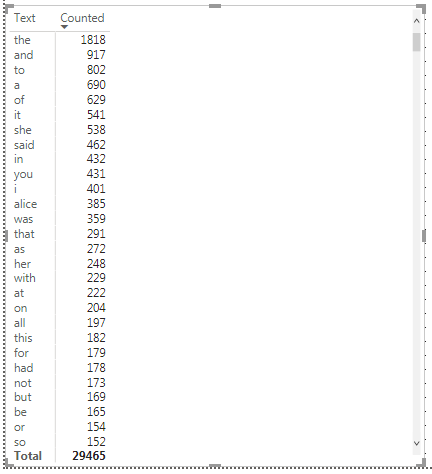
Sort the Counted Column descending.
Click on the Counted Column
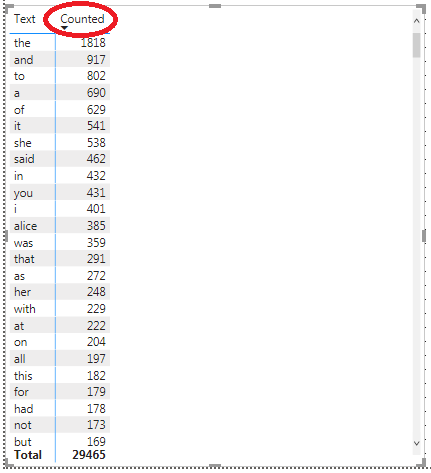
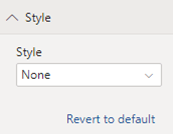
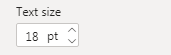
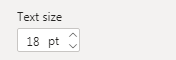
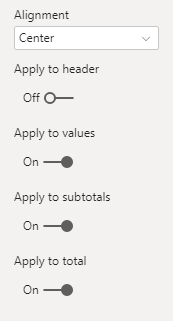
To Format the Matrix Object
Click on the Paint Roller icon
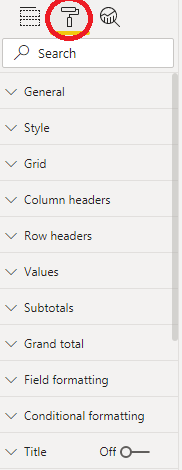
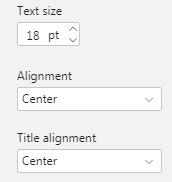
Edit the following areas as displayed


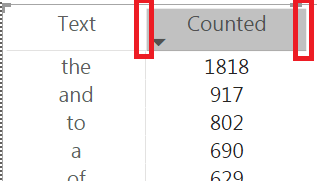
Adjust Matrix Column sizes by dragging edges
When inserting a new Visualization, make sure no other Objects are selected. Otherwise you’ll overwrite the existing Object.
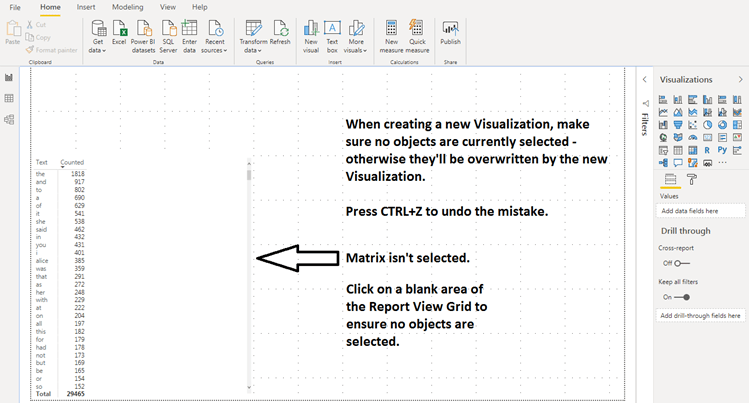
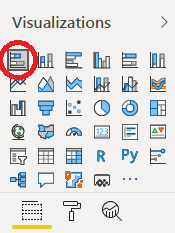
Insert a Bar Chart
Make sure no other Objects are selected first.
Move and resize the Bar Chart.
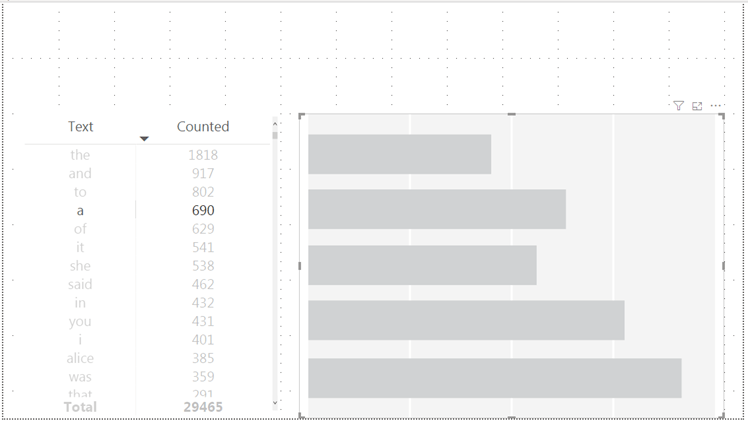
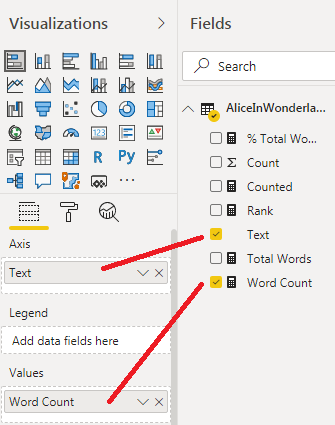
Drag the Fields as displayed to populate the Bar Chart
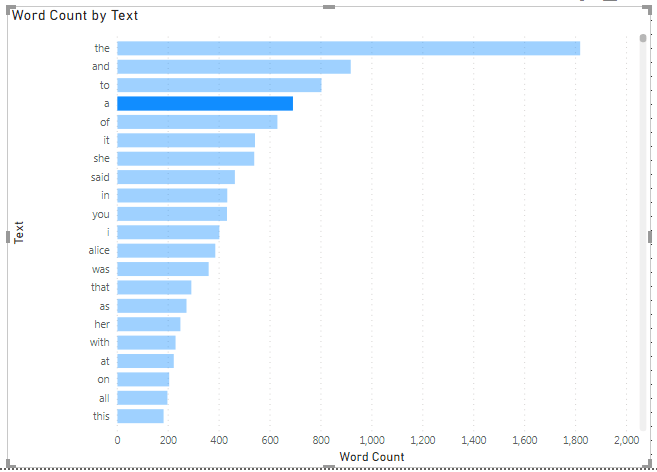
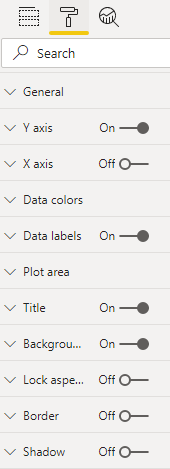
Select the Paint Roller icon, and format the Bar Chart as you desire.
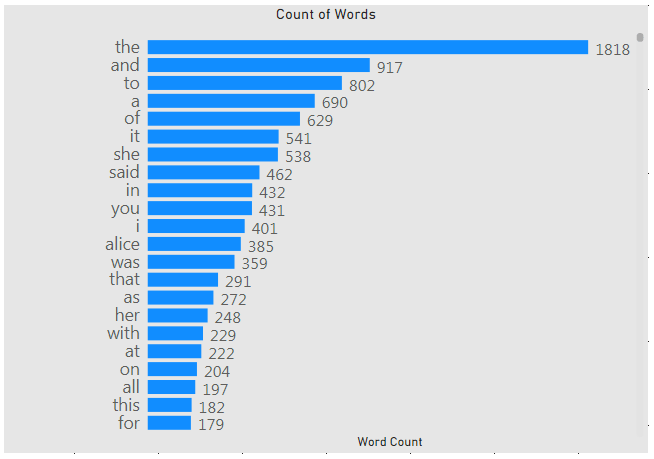
Formatted Bar Chart
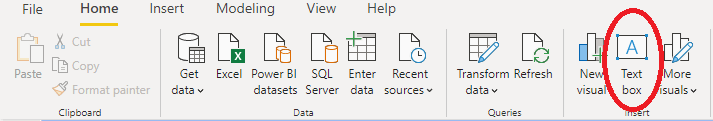
Create a Title
Home Ribbon > Text Box
Enter Title into the box
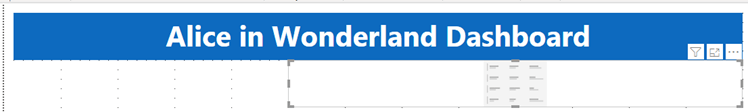
Change background colour using the Paint Roller icon.
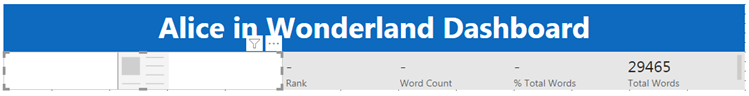
Insert Multi-Row Card
Move underneath Title and resize
Drag the Fields as displayed
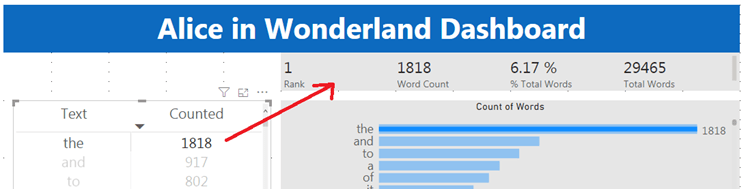
Selecting a row in the Matrix will now populate the Mult-Row Card.
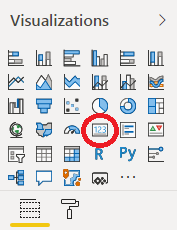
Insert Card – to display our selected word from the Matrix.
Move underneath Title and resize.
Drag Field as displayed
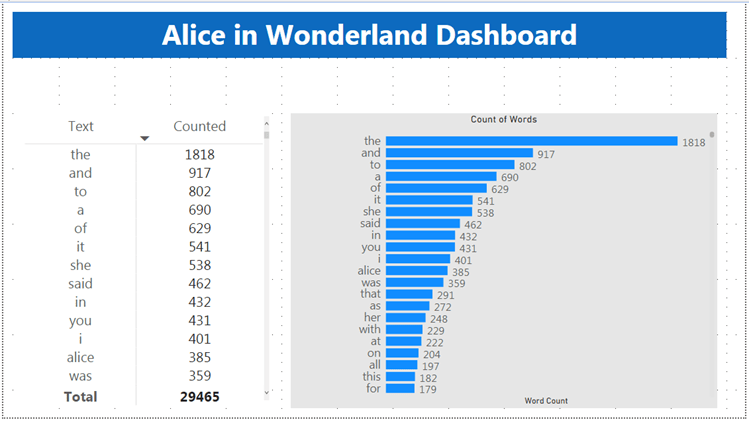
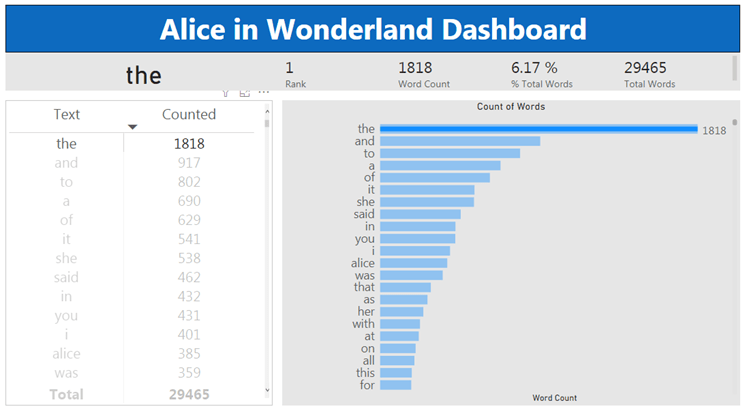
Finished!
The completed Dashboard

Selecting an item from the Matrix – displays additional information in the Multi-Row Card
Thank you for reading, and i hope you found the tutorial useful 🙂
