by Rakesh Pal
Whilst working for Procurement at an NHS hospital i was assigned to deliver goods on behalf of the Housekeeping Stores.
The Housekeeping Stores main task was to provide goods for the Cleaners to perform their roles, throughout all of the wards at the hospital and its perimeter buildings.
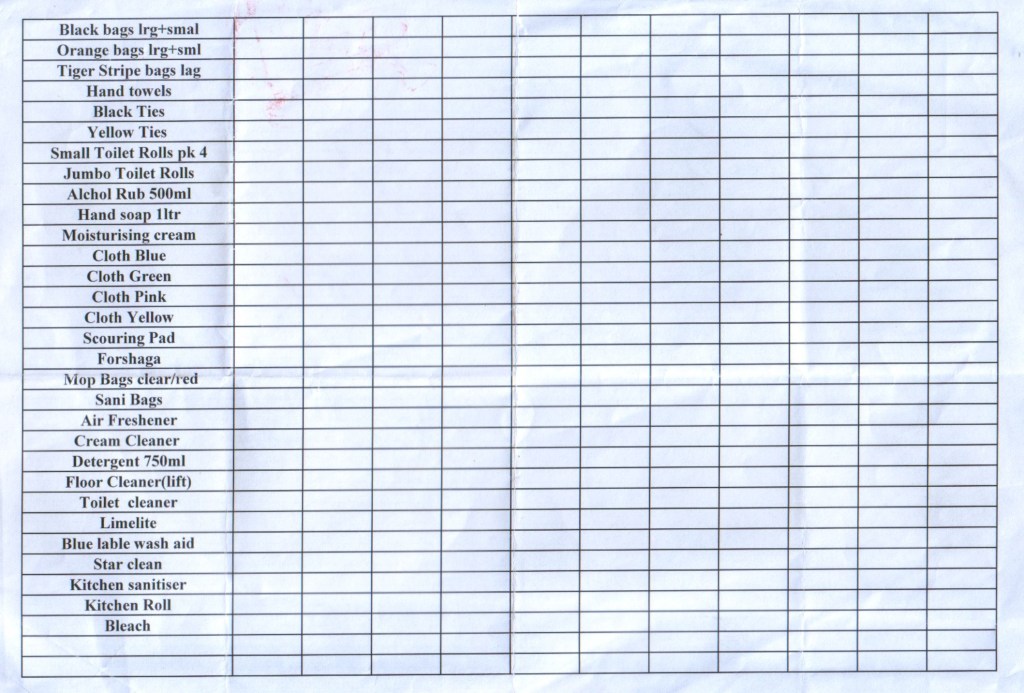
I was introduced to a spreadsheet, which displayed the daily orders of goods to be delivered on each weekday.
The spreadsheet was crude, inefficient, and utliizied none of the tools and features of Excel. The disadvantages I observed:
- Time consuming – Products had to be manually entered.
- Naming conventions – two colleagues may type in a Product name differently.
- Data Analysis – there was no means to analysis the data – for e.g. Total Cost, Total Units
Everyday, the daily orders that were delivered, were recorded through a web based Inventory system called GV Clematis.
The system provided a downloadable CSV file, that listed all of the products, categories, and prices used by the Housekeeping Stores.
However, this valuable information was not utilized.
I decided to create my own Daily Orders Tracker, addressing the issues I found.
I wanted to create an easy to use interface, allowing the User to input data quickly.
Furthermore, I wanted to present and analysis the data, asking the following questions –
Metrics:
- Total Cost and % of Grand Total – by Ward / Category / Product
- Average Cost, Weekly Cost
- Total Units – by Category and Product
- Product Unit distribution over Wards
- Product Unit distribution per Ward
- and so on
My Goals:
- Load, clean, and modify the Products.csv file.
- Build Dimension Tables / Create Relationships
- Create DAX formulas
- Build a Daily Orders Table, for the User to input data.
- Build a Fact Table from the Daily Orders Tables.
- Create Visualisations that are clear and easy to understand.
My Tracker makes use of:
- Excel Formulas
- Drop Down Lists
- Power Query
- Power Pivot
- PivotTables
- Data Slicers
- Conditional Formatting
- the information contained within the CSV file.
The tracker allows the User to do much more than the exisiting spreadsheet.
Daily Orders Table
By making use of drop down lists the User is able to enter information quickly and avoid naming errors. Each Ward has it’s own column (green headers) and can be populated with the required number of Cases/Units.
Enter Custom Products
Products can manually be added to the drop down lists if they don’t appear in the Products.csv file. This might be useful for goods that are purchased from different Suppliers.
Reports
A Total Cost report, detailing Daily Cost, Average Cost, Weekly Total, and % of Grand Total.
Total Units report. How many Cases and Units each Product used.
Product Distribution over Wards – to determine which Ward had the highest number of Units for each Product.
Product Distribution per Ward – to determine how many units of each Product a Ward used.
Please download the Excel file to see more Metrics.
I hope you found the Tracker useful.
If you have any questions or comments please leave them below.
