By Rakesh Pal
I wanted to produce a report from a gun violence dataset i found online: https://github.com/jamesqo/gun-violence-data (Thank you to Jamesqo for creating the dataset)
The dataset contains over 260k of gun violence incidents in the USA, from 2013 to 2018. I wanted to analysis and present the data, asking the following questions –
Metrics:
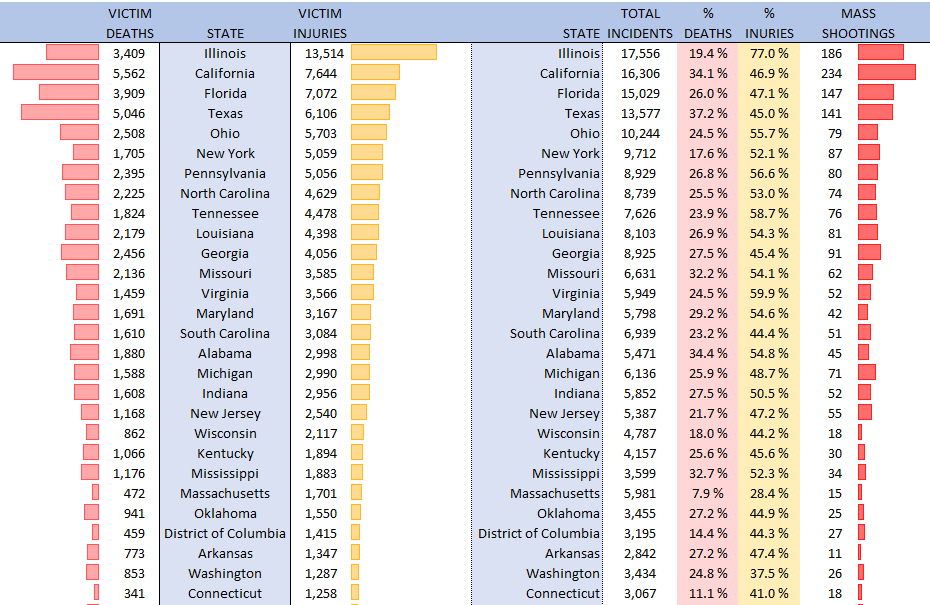
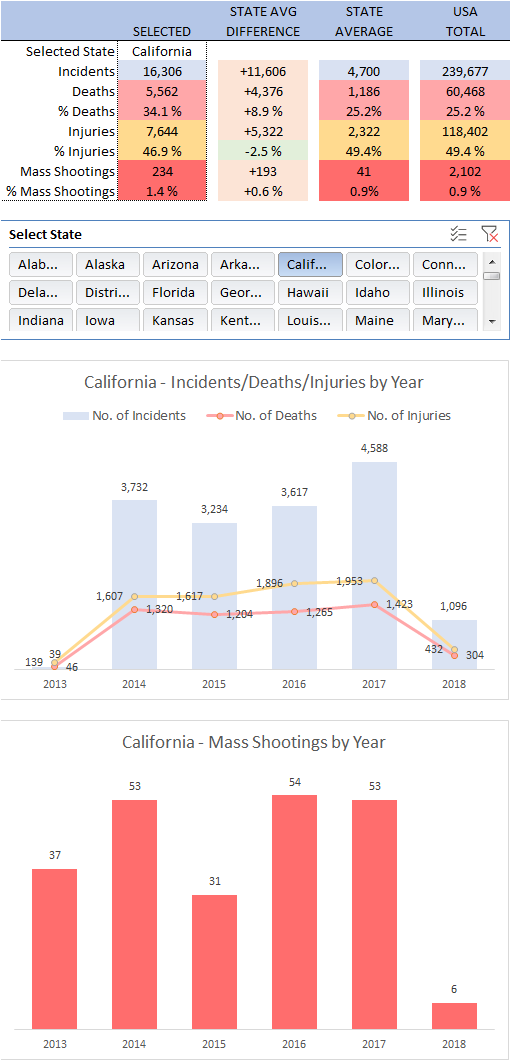
- How many deaths and injuries occured per state?
- How many mass shootings occured?
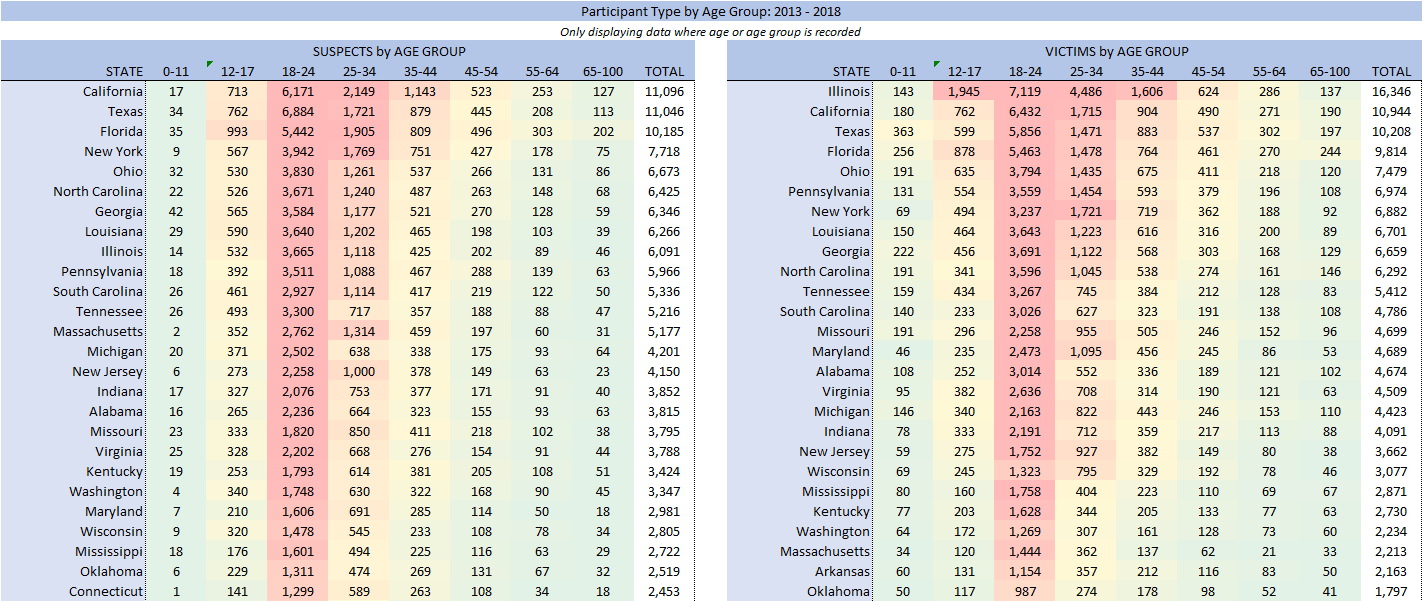
- Which age group accounted for the most suspects/victims?
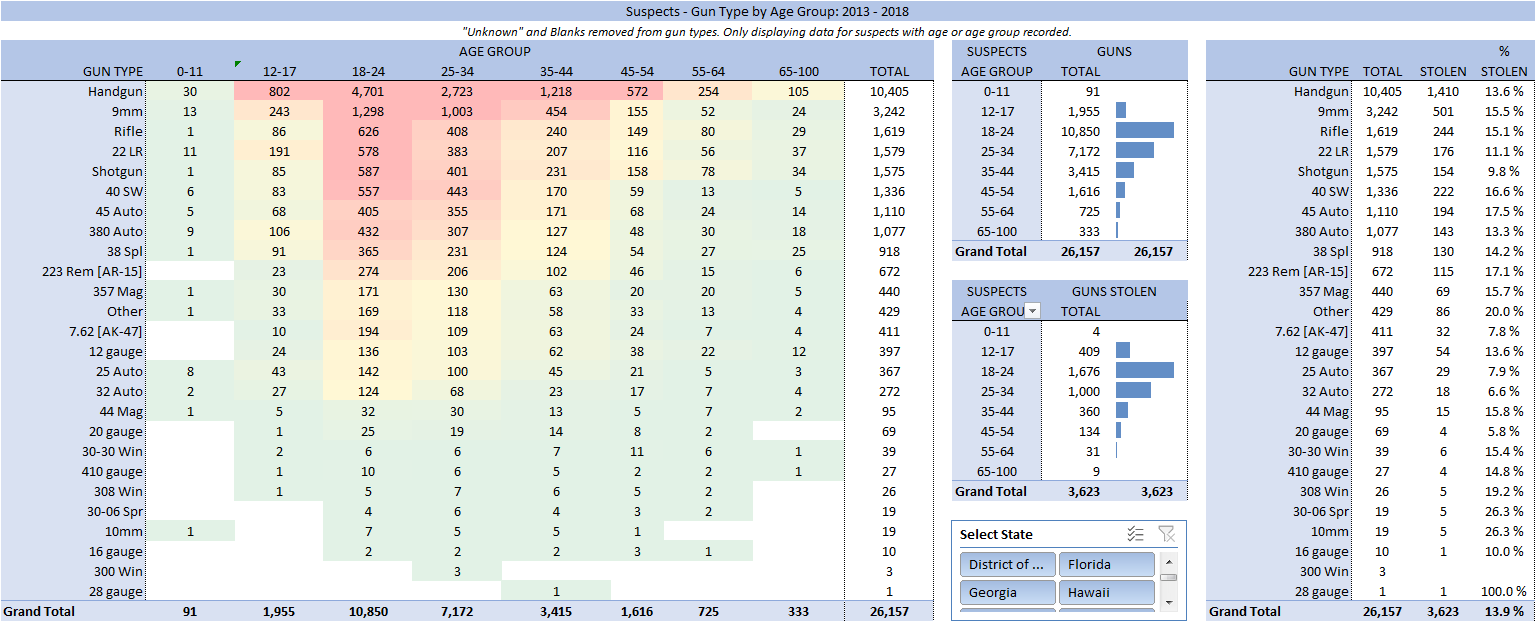
- Which type of weapon was most commonly used and by which age group?
- What percentage of weapons were stolen?
- And so on…
Our Goals:
- Load, clean, and modify the dataset
- Build Dimension Tables / Create Relationships
- Create DAX formulas
- Make use of PivotTables, PivotCharts, Data Slicers, Conditional Formatting, Colour Scales, to present our data.
- Create Visualisations that are clear and easy to understand.
Metrics by State

Participant Type by Age Group
Gun Type Metrics
Please download the Excel file to see more Metrics.
I don’t currently have time to create a detailed write up of how the Report works, though i plan to do so in the future.
