
by Rakesh Pal
Whilst enrolled on a Data Science course, I was introduced to the Microsoft Northwind dataset.
We used the Northwind data to test our knowledge of SQL functions.
I challenged myself to produce a report from the dataset – focusing on the Employee and Category data.
I performed data analysis with the use of Power Query, Power Pivot, and DAX Measures.
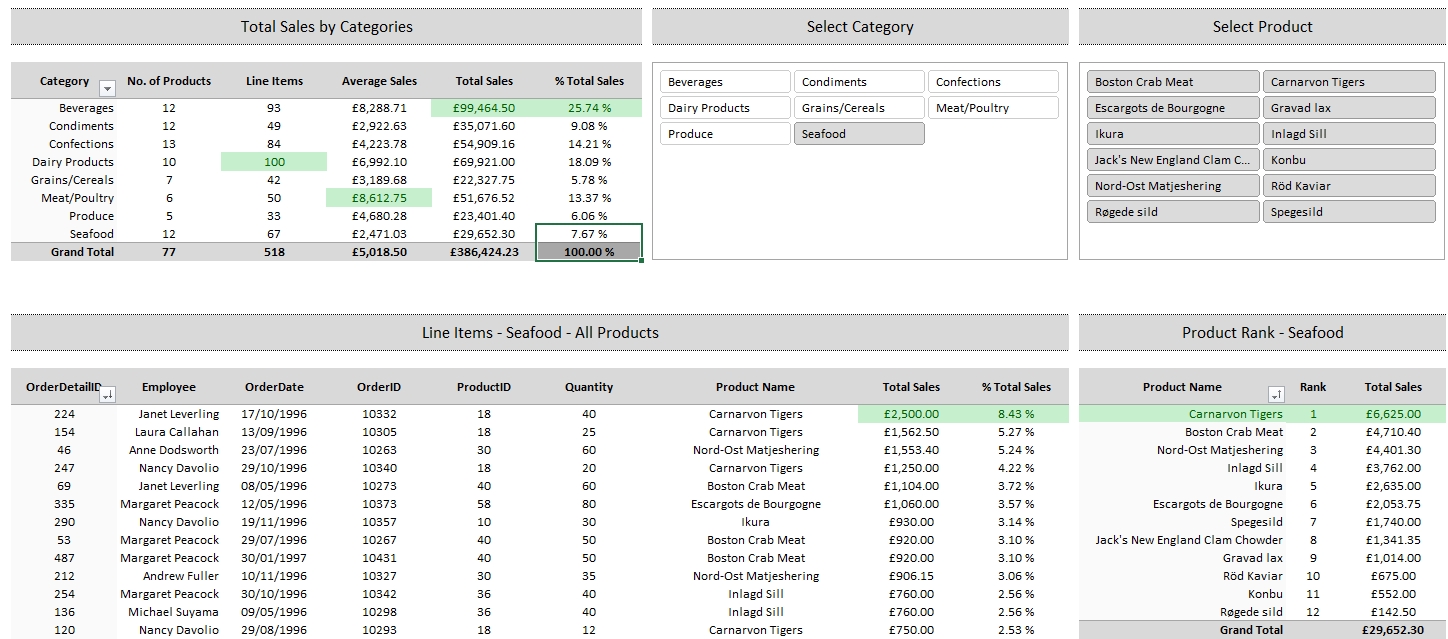
In addition, I created dashboards – presenting data visually with PivotTables and Charts, and allowing for futher analysis with data slicers and conditional formatting.
Data Model
Heres an overview of the Data Model.
The Customers, Employees, and Shippers tables are dimension tables, which filter the Orders table.
Additionally, the Products table is filtered by the Categories and Supplier tables.
The Order and OrderDetails tables are essentially fact tables.
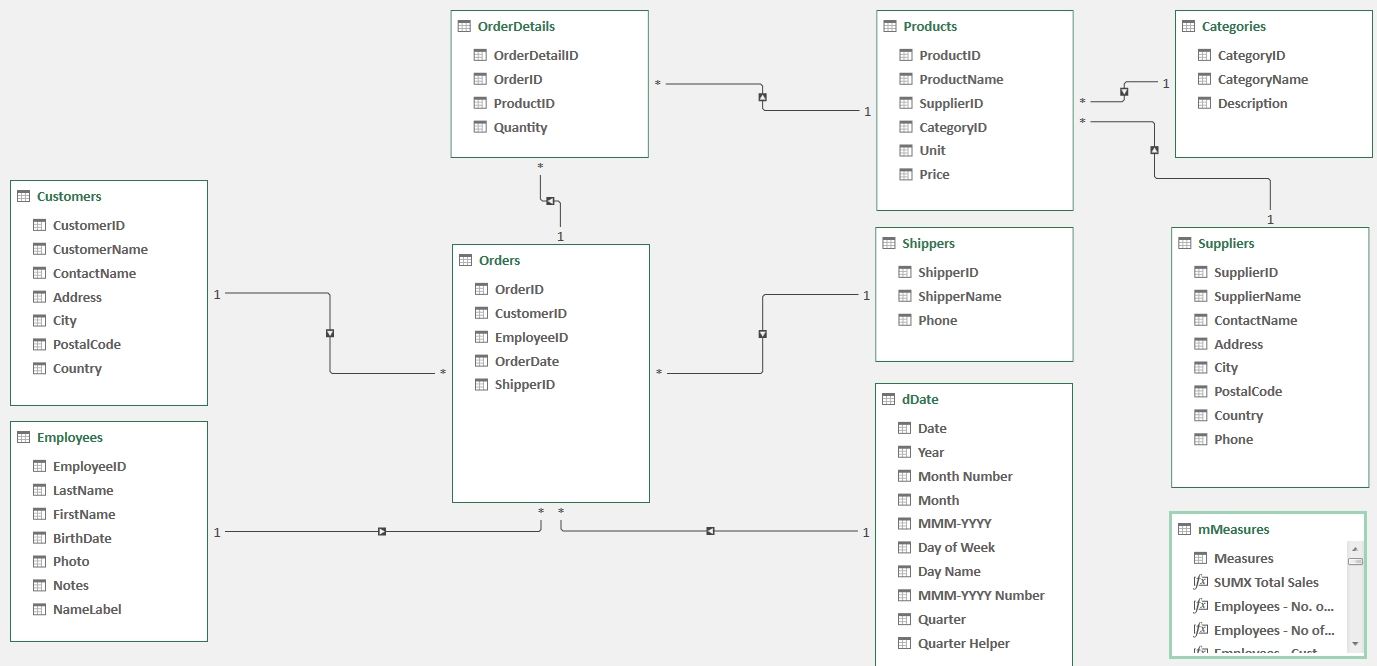
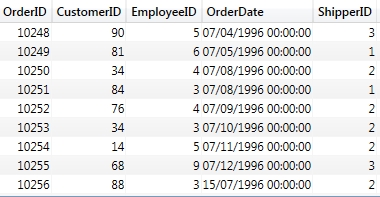
Each Order placed by an Employee / Customer has a unique OrderID.
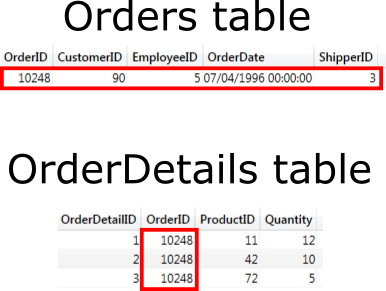
The OrderDetails table represents the multiple line items that make up an Order. Each line item has an unique index, OrderDetailID. Indeed, we can observe the One to Many Relationship between Orders and OrderDetails.
I iterated the OrderDetails table in my calculations, for e.g. to calculate Total Sales I would use the SUMX function to multiple the quantity by the current ProductID’s price. We use the RELATED function to pull the price from the Products table, since we are propagating a Many to One Relationship.
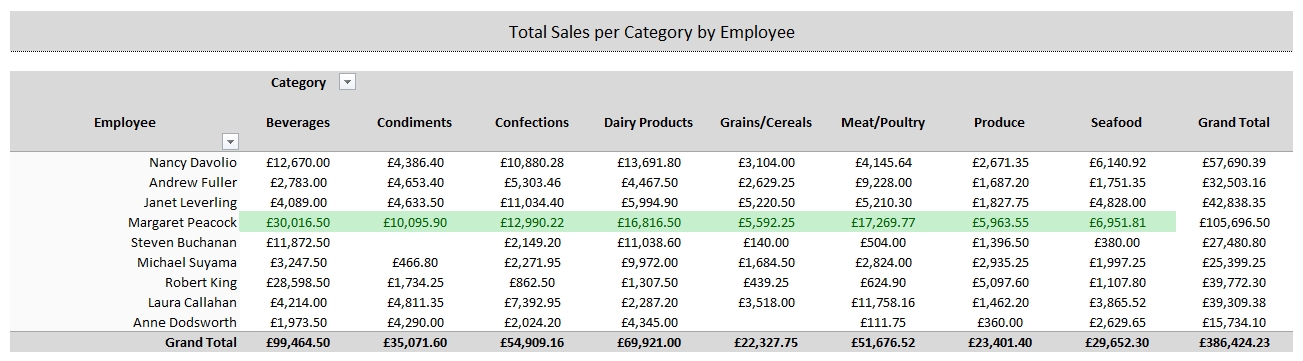
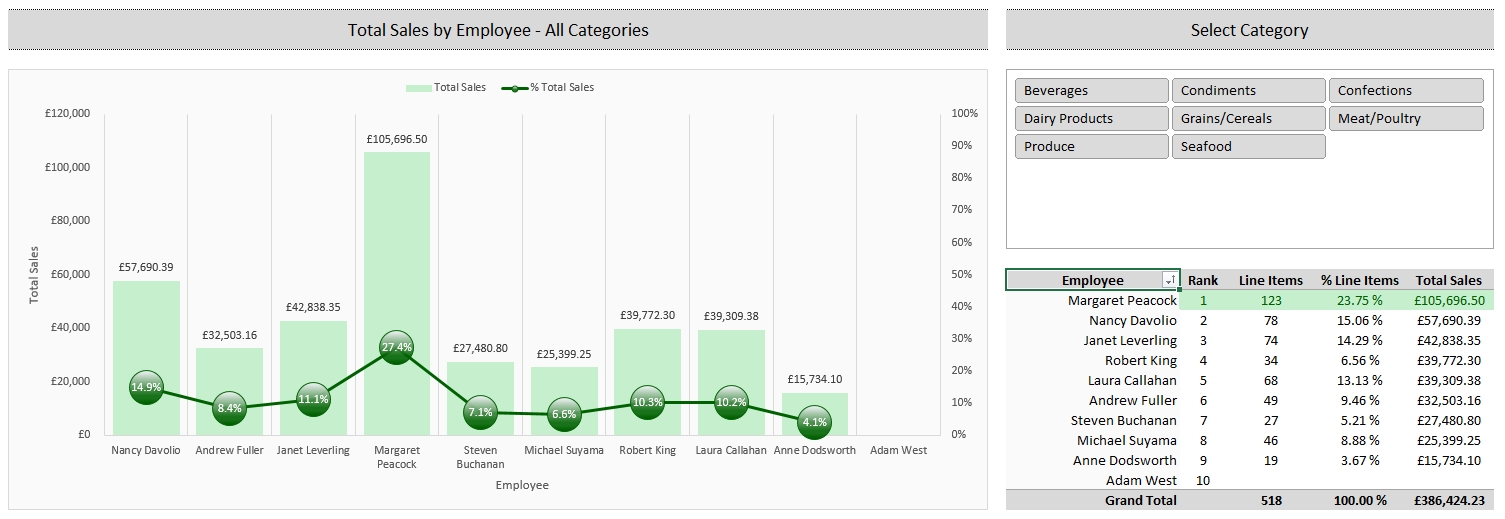
Employee Metrics
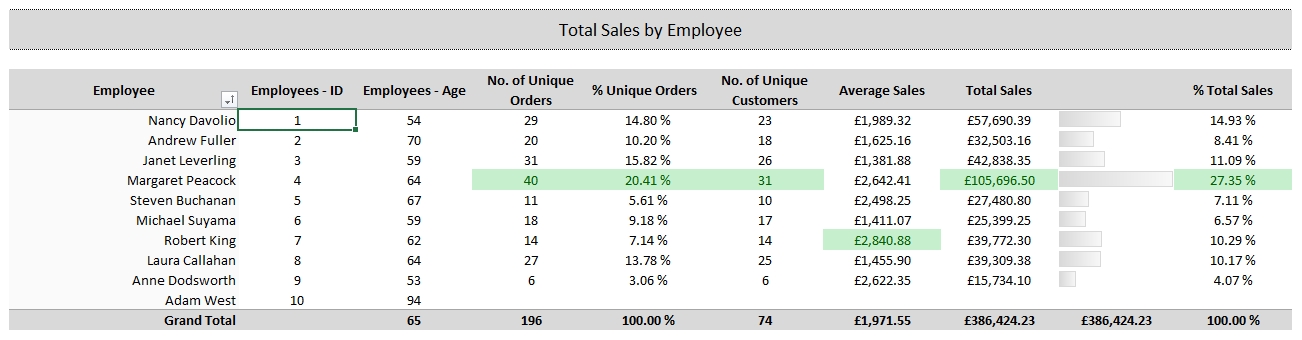
The Employee metrics are analysed via Total Sales and Total Sales per Category measures. We can summarise that Magaret Peacock leads all employees in performance. Despite this, Robert King has the highest average sales.
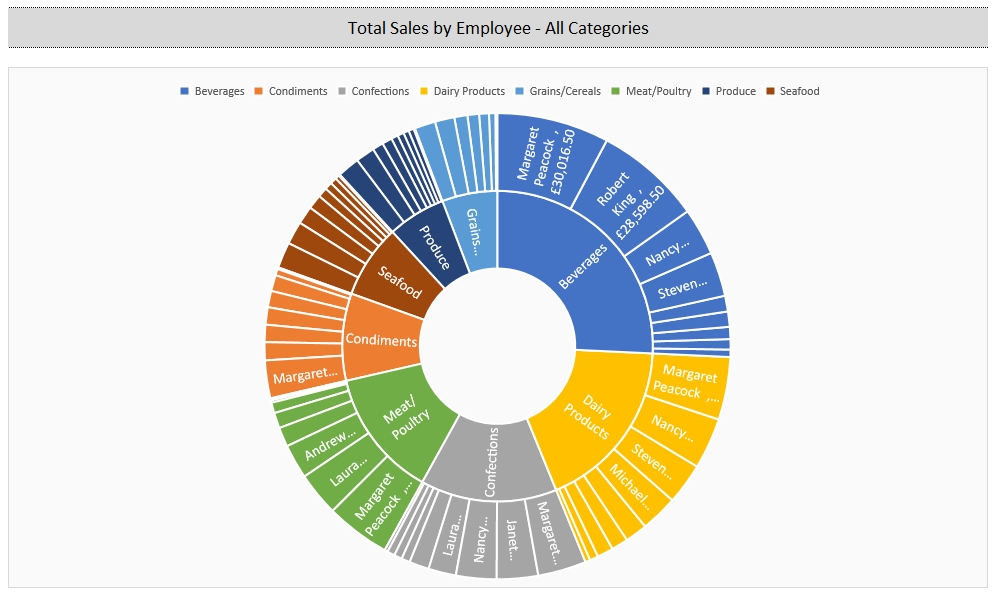
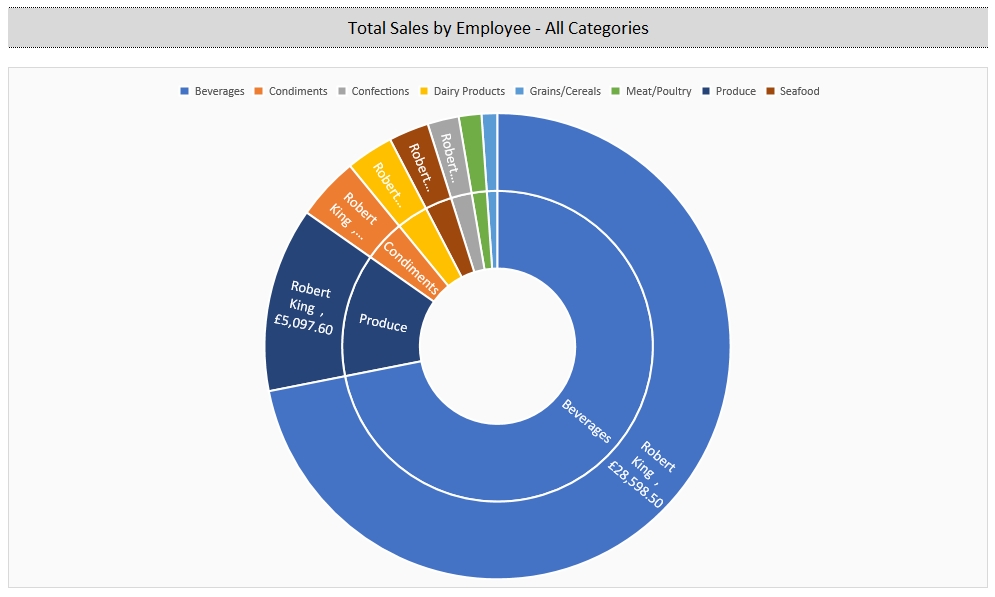
The Sunburst visual gives us an easy to interpret breakdown of categories and total sales. With the use of slicers we can further analyse performance, for e.g. Robert King’s highest proportion of sales are in the beverages category.
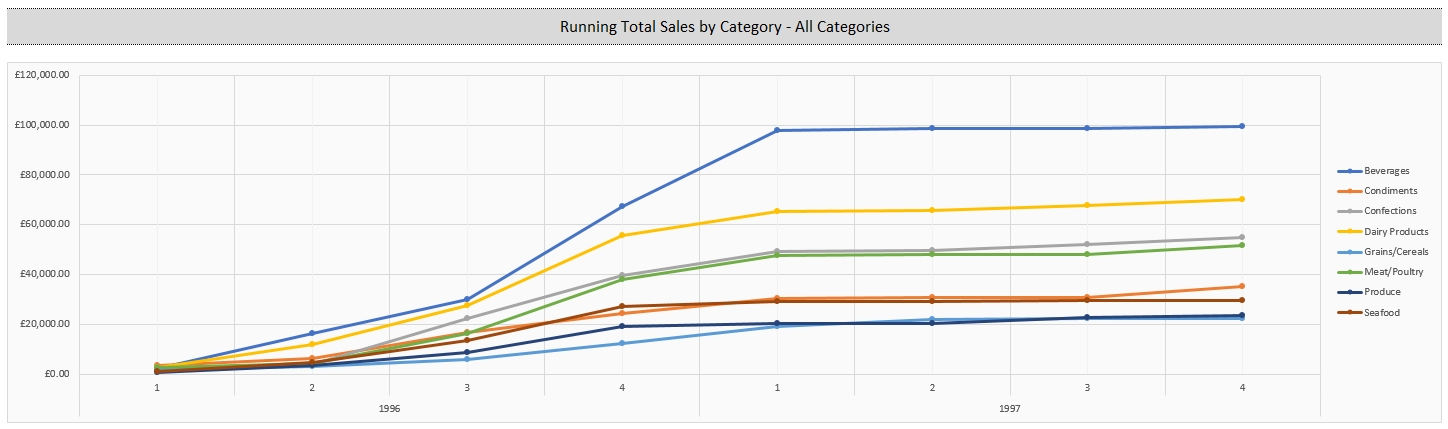
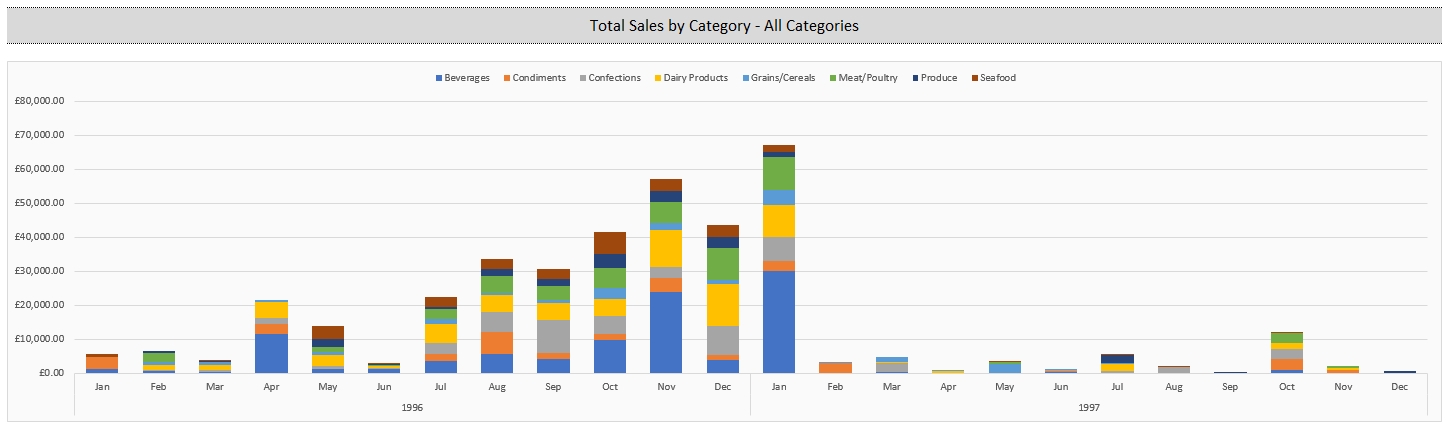
Category Metrics
The category sales are analysed with the Running Total Sales and Total Sales by Category measures. We can summarise that the highest period of sales occured during Q2 1996 – Q1 1997, and subsequently levelled off.
Please download the Excel file to see the Report in detail.
I hope you find the Report useful.
If you have any questions or comments please leave them below.
